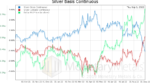
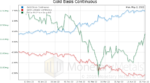
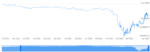
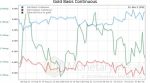
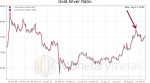
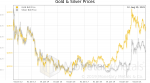
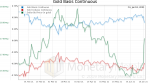
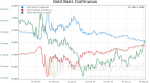
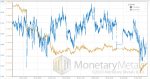
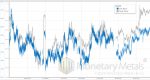
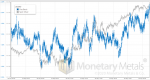
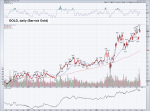
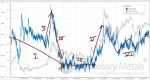
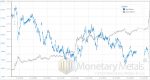
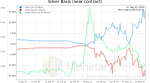
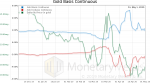
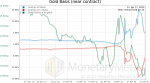
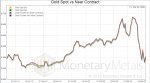
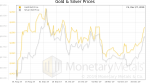
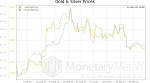
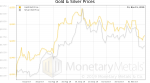
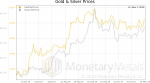
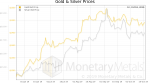
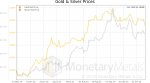
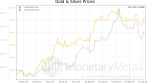
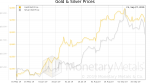
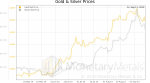
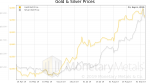
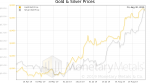
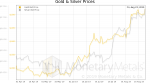
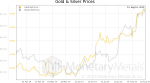
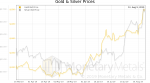
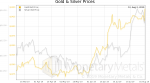
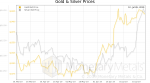
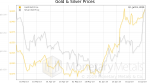
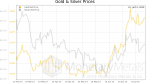
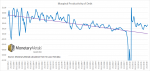
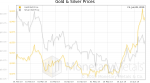
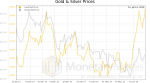
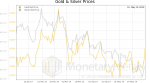
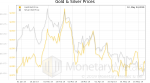
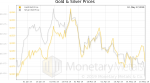
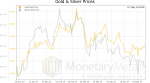
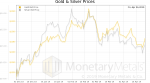
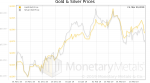
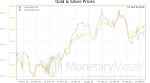
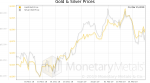
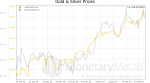
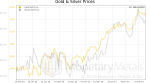
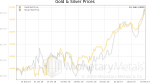
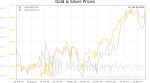
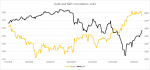
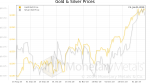
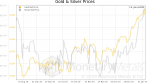
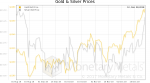
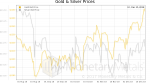
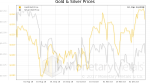
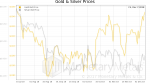
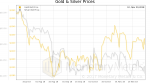
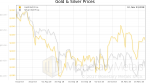
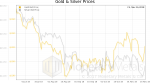
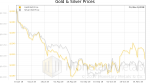
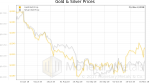
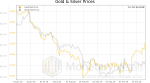
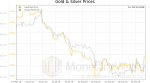
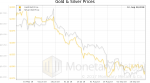
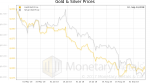
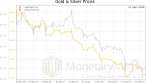
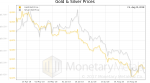
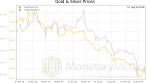
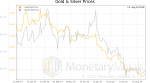
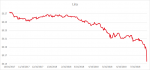
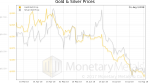
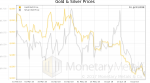
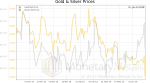
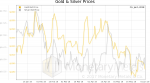
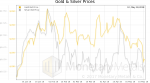
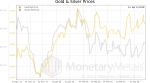
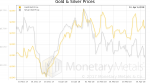
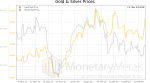
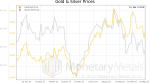
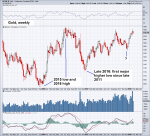
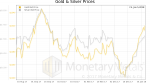
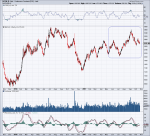
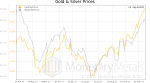
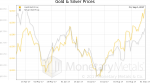
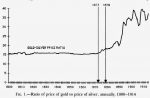
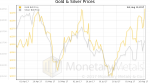
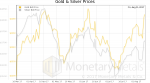
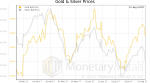
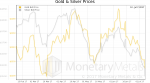
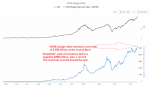
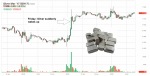
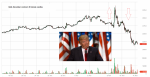
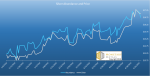
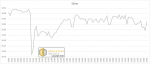
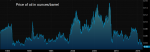
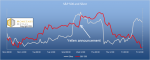
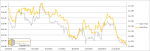
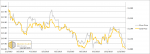
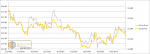
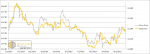
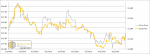
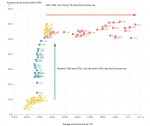
One way to look at the price of gold, is that it dropped from its high around $1,900 in early June. Another way is to zoom out, and look at the big picture. Here is a 10-year chart of gold and silver prices.
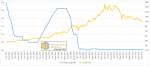
For over four years, after the peak around $1,900 ten years ago (early September 2011), the price of gold moved down. By December 2015, it was just over $1,000. Then it was a sideways market until three years ago (August 2018), when the price was well under $1,200. It spent two years rapidly rising, to well over $2,000 a year ago (August 2020). Since then, it has been down and sideways to its current level under $1,800.
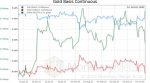
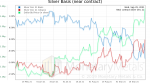
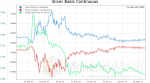
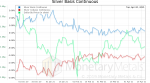
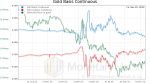
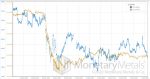
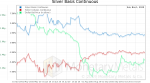
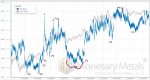
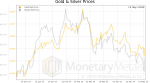
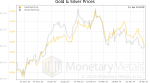
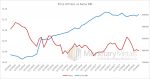
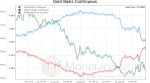
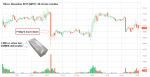
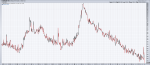
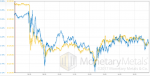
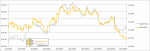
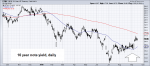
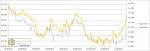
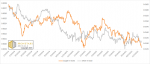
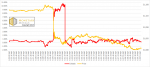
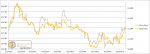
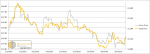
The silver price has had a greater fall, and did not begin to rise until later (it was under $12 until the onset of the Covid lockdown). Its rise may have begun later,
Read More »