


Keith Weiner
My articles My offerMy siteAbout meMy videosMy books
Follow on:LinkedINTwitterSeeking AlphaFacebookAmazonGoogle +
Claim-Less DeliriumYesterday, the Department of Labor announced that initial jobless claims dropped. Quite a lot. So naturally, markets reacted. The stock market began to rise. The euro rose, at least for a while. |
Unemployment Claims Index, Aug 1998 - Oct 2017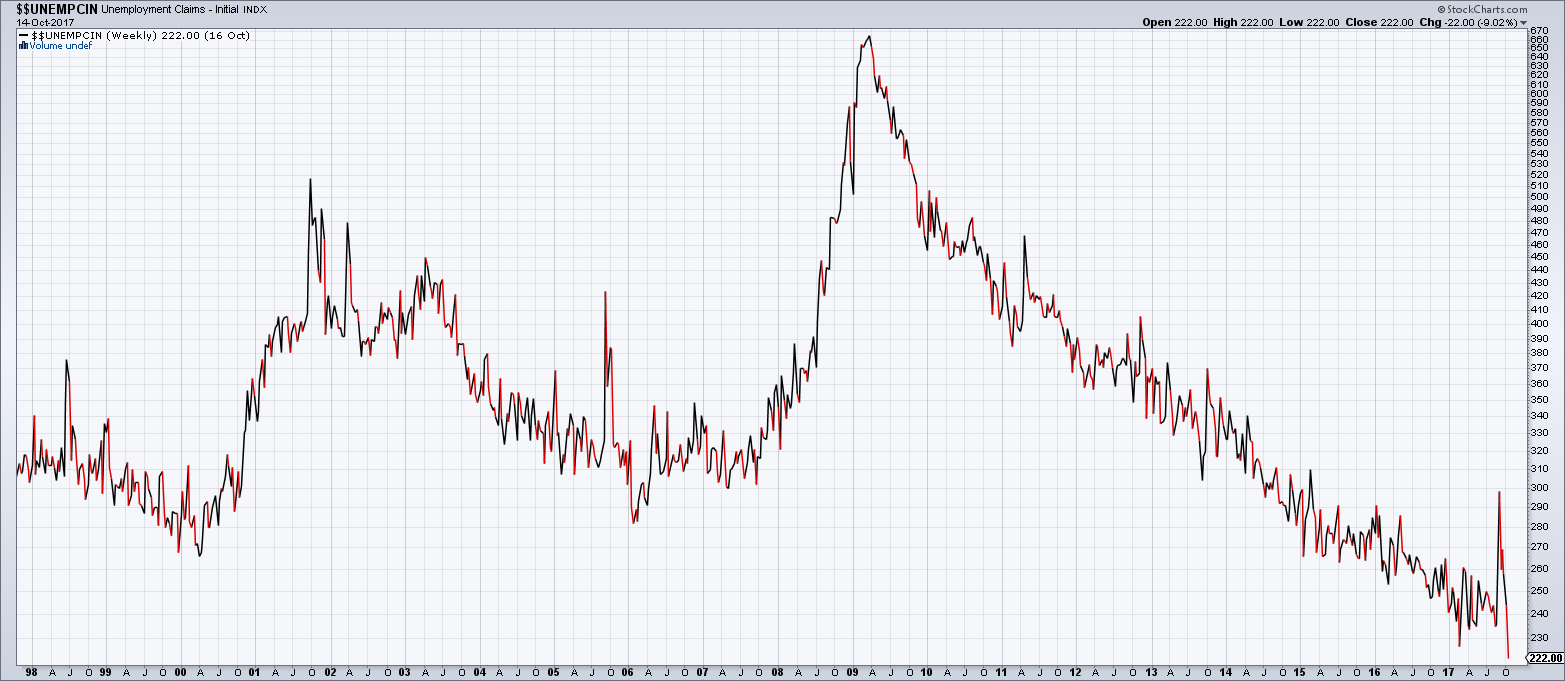 Initial weekly unenjoyment claims over the past 20 years. Can you say “contrary indicator”? - Click to enlarge The most recent palpitations in this measure were driven by assorted named hurricanes making landfall – a very similar effect could be observed in 2005 when Katrina devastated New Orleans. What is most remarkable though is that in the QE-distorted bubble economy initial claims have actually been driven way below the levels of early 2000, which were long considered modern-day extremes. In fact, comparable numbers were last seen shortly after Nixon’s “temporary” gold default – nearly 50 years ago. Anyone holding or planning to buy stocks should ponder the correlation of this indicator with stock prices – its history suggests that right now is probably one of the worst times ever to buy stocks. The same conditions tend to midwife long term upward trends in gold. Don’t let the current boom-driven distortions fool you into believing everything is fine. Consider this example: from 1920 until late 1922 Germany’s unemployment rate stood at less than 2%, as the Reichsbank ran the printing presses at full throttle day and night. One year later it had surged to 25%. We obviously don’t want to insinuate that a replay of Weimar is underway; we only want to make the point that economic conditions created by massive money printing are an illusion invariably fated to be shattered. |
| And the prices of our favorite heavy metals rose, particularly silver. Silver was around its low of $16.92 before the report. Two and a half hours later, it was $17.26. Our first reaction was to ask, “really?? Falling unemployment causes silver buying?”
OK, sure, we suppose if everyone is maximally employed, they will buy more jewelry, electronics, solar panels, and all of the consumer products that contain silver. Or, perhaps they will buy silver coins and stack them. However, a 2 percent increase in just over 2 hours seems overdone. So we turned to the data to take a look. We have described the basis theory many times. Today, let’s just state it simply. If speculators are buying, they want leverage and they tend to use futures. If there is real demand for real silver, these businesses and stackers buy real metal. These are two different markets, with two different prices. |
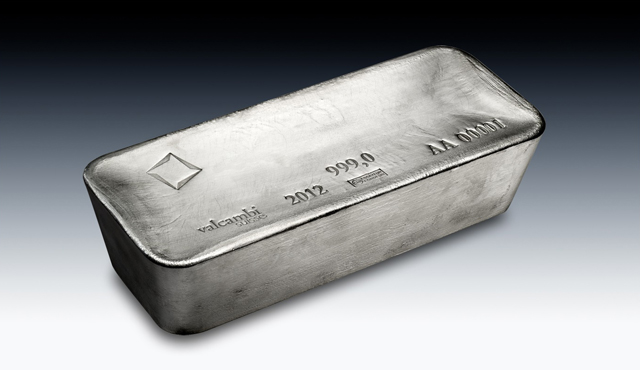
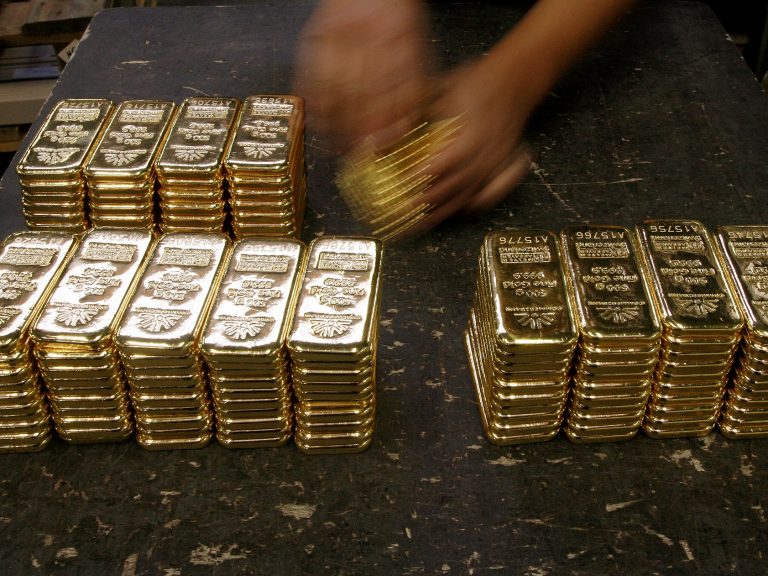 Anonymous stacker making little piles of 500 gram bars of glittering here-and-now gold - Click to enlarge |
Physical Demand Still LackingSo we want to look to see the change in the futures price, not relative to where it was, but relative to the spot price. We know how much it changed over 150 minutes: 34 cents. We want to look at how much it changed relative to the price of real metal. This difference between future price and metal price is called the basis. If the basis increased, it means that the price action was driven in the futures market. If a speculator bids up the price of a silver futures contract, then the basis goes up. A market maker will pull up the price of spot silver — you will not see the price of the futures just divorce itself from spot. But the spot price is pulled up reluctantly, lagging behind. Our data platform can show these moves in high resolution. Here is the intraday graph, showing the gold price and the gold basis (December contract) before, during, and after the move. |
Gold Basis Intraday(see more posts on gold basis, )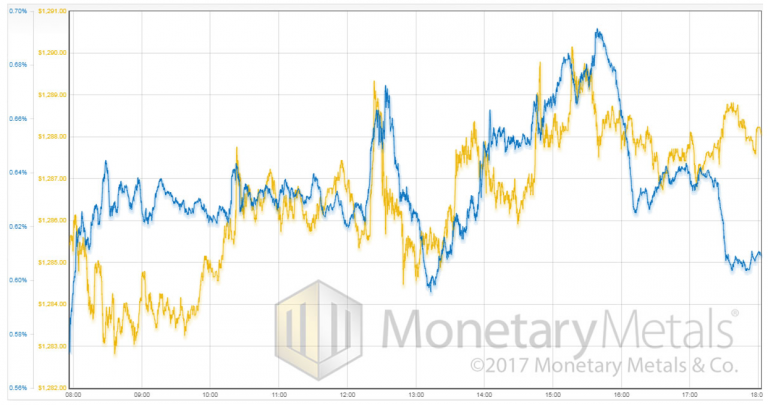 Thursday’s intraday moves in the gold price and the December basis. - Click to enlarge We would note that a rise in the gold price on a sharp fall in jobless claims is counter-intuitive, which makes it actually interesting (silver arguably had a better “reason” to be firm, on account of its industrial demand component). |
The move in gold was about $6. Yet we can clearly see there is a pretty good correlation between basis and price. The conclusion: speculators saw the news item, decided gold should go up, and made it happen. They front-run what they theorize ought to happen.
But the fundamental demand is not there. Perhaps one of these days, they will be right and demand for physical metal will increase sharply after the speculators buy in. But we suspect that this was not that day.
Note though that the basis shows a rise at the very start of the graph, and remains high until after 10am (GMT) when the correlation with price clicks into place. We place less weight on the drop in the basis at the end. Sometimes spreads do funny things at the end of the trading day.
The percentage move in silver was about four times bigger.
Full story here Are you the author?Tags: gold basis,newslettersent,Precious Metals